Excel For Data Analysts
Website Design
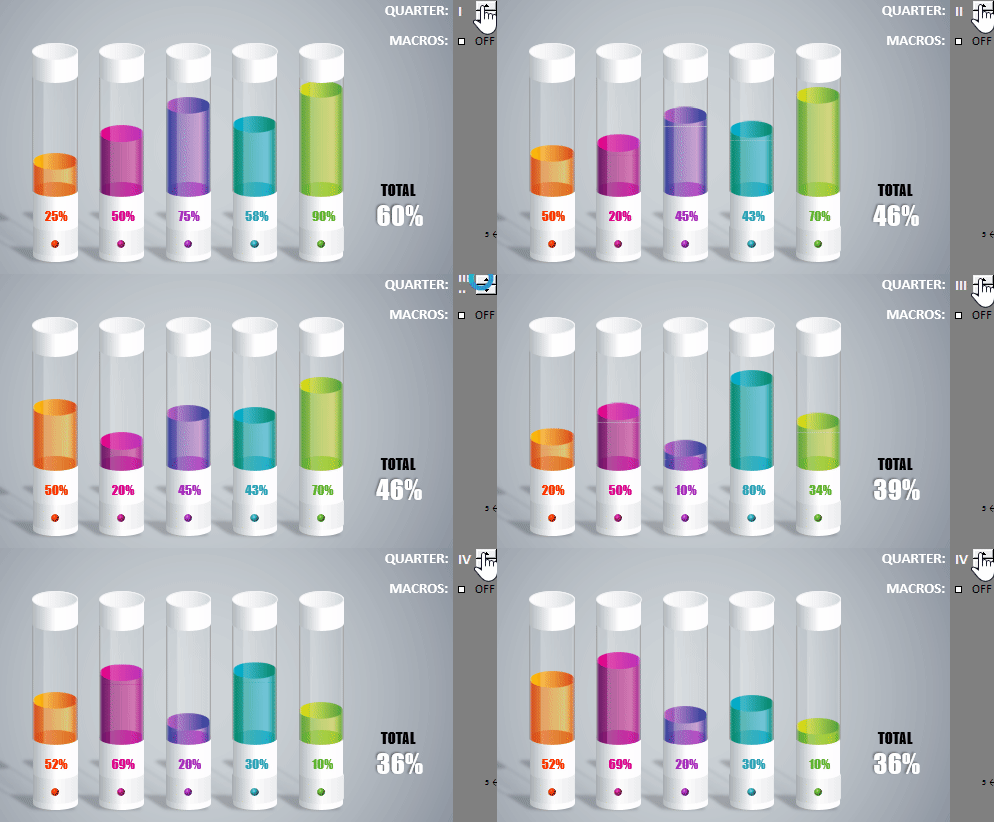
This 3- day hands-on Excel data analysis training course will expand one’s ability to analyse large amounts of data and professionally present results. Gain the knowledge and skills to build more sophisticated spreadsheets, perform What-If analyses, apply functions, manipulate PivotTables, and use the advanced features of Excel to make and present better business decisions.
More Details.. Edspik Trainer

Data Visualization with Tableau
Why Tableau?
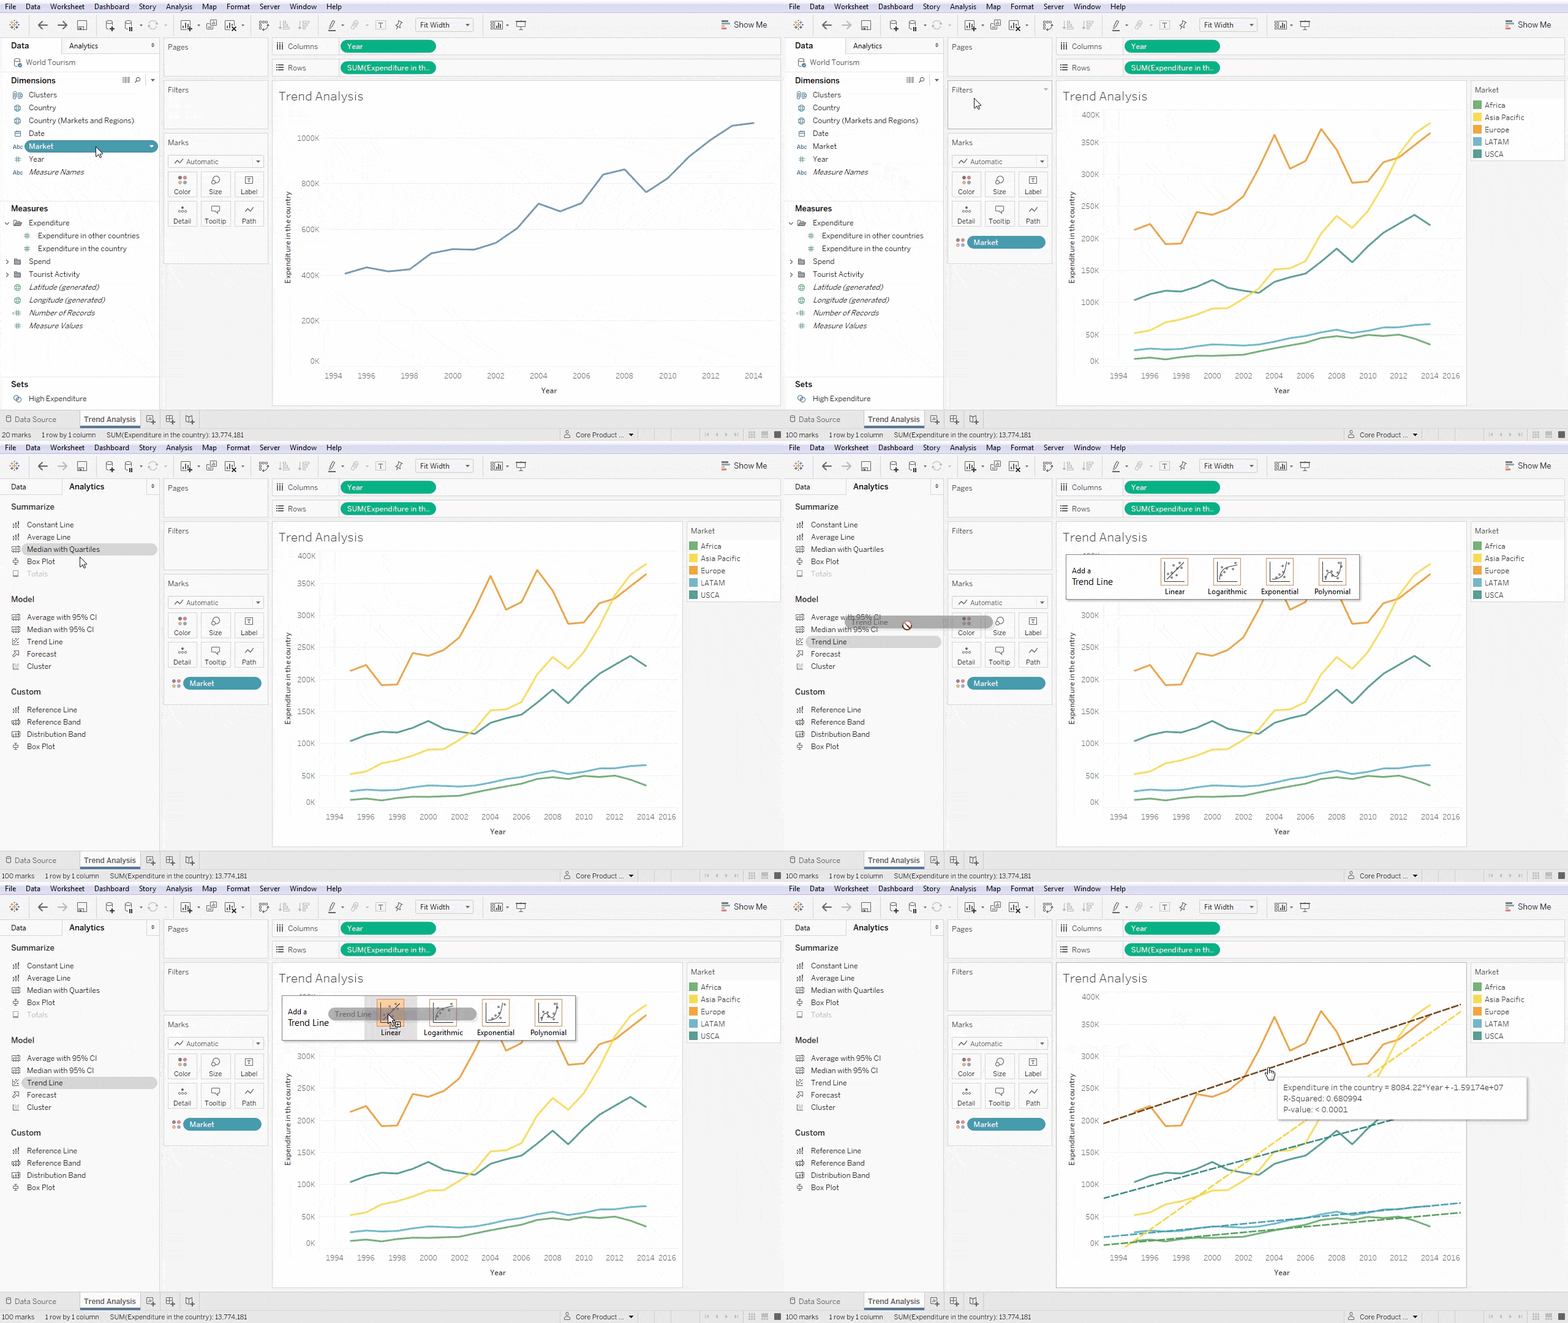
This 3 – day course will equip one with know how knowledge to explore, visualize, and securely share data in the form of Workbooks and Dashboards using Tableau. Tableau is a widely used business intelligence (BI) and analytics software trusted by a number of companies. With its user-friendly drag-and-drop functionality it can be used by everyone to quickly clean, analyse , and visualize your team’s data. Moreover, delegates will learn how to navigate Tableau’s interface and connect and present data using easy-to-understand visualizations.
More Details.. Edspik Trainer

Data Visualization With PowerBI
Why PowerBI?
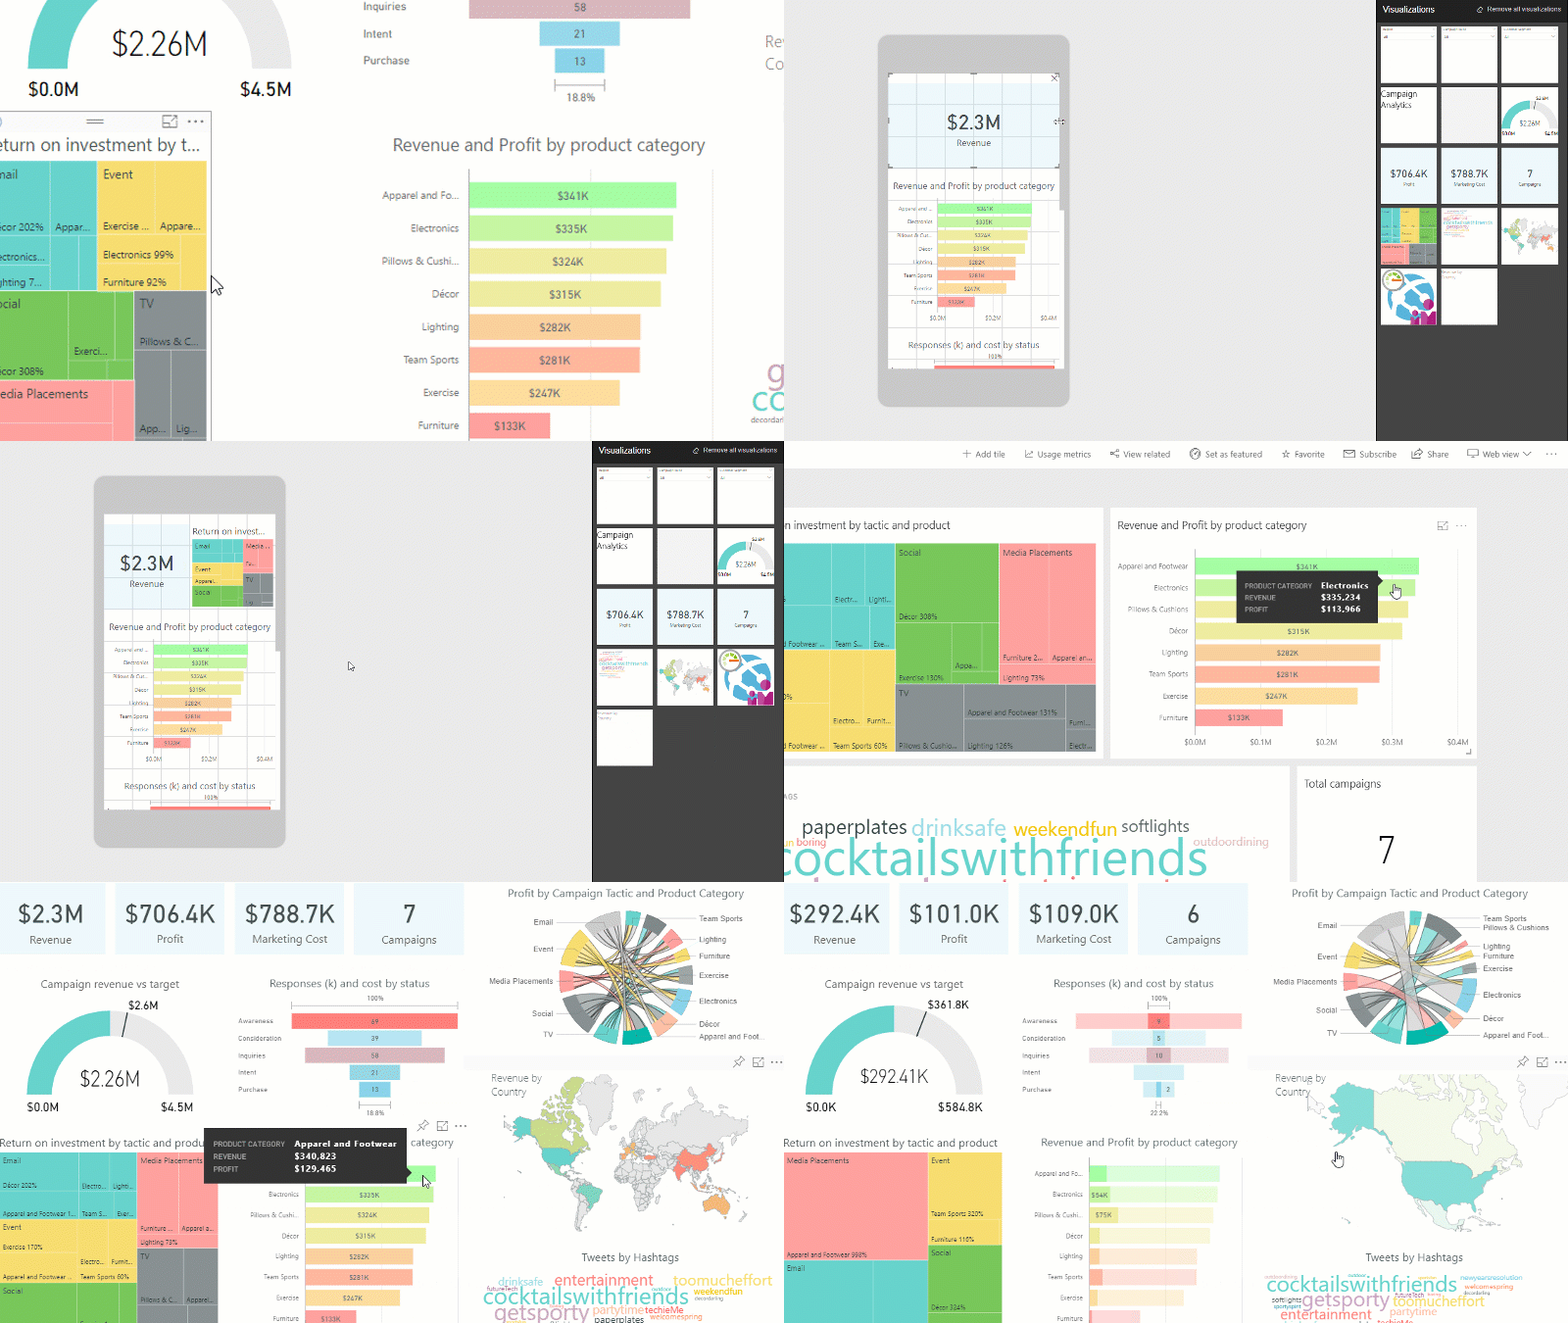
This 2- day course will help one to discover how to leverage this easy-to-use tool to more efficiently model and visualize data. Delegates will learn how to connect various data sources, including Excel, databases, and web data sources. Moreover, delegates will learn how to build and arrange visualizations, create interactive reports and manage published files in the Power BI service. Power BI Desktop is a powerful data analysis and visualization software from Microsoft. This software can help you get more insights from your data, whether that data is stored on your computer or in the cloud.
More Details.. Edspik Trainer n